Let’s get straight to the point: No country gets close to a perfect score in the Corruption Perceptions Index 2016.
Over two-thirds of the 176 countries and territories in this year’s index fall below the midpoint of our scale of 0 (highly corrupt) to 100 (very clean). The global average score is a paltry 43, indicating endemic corruption in a country’s public sector. Top-scoring countries (yellow in the map below) are far outnumbered by orange and red countries where citizens face the tangible impact of corruption on a daily basis.
Corruption Perceptions Index 2016
Corruption and inequality: How Populists Mislead People

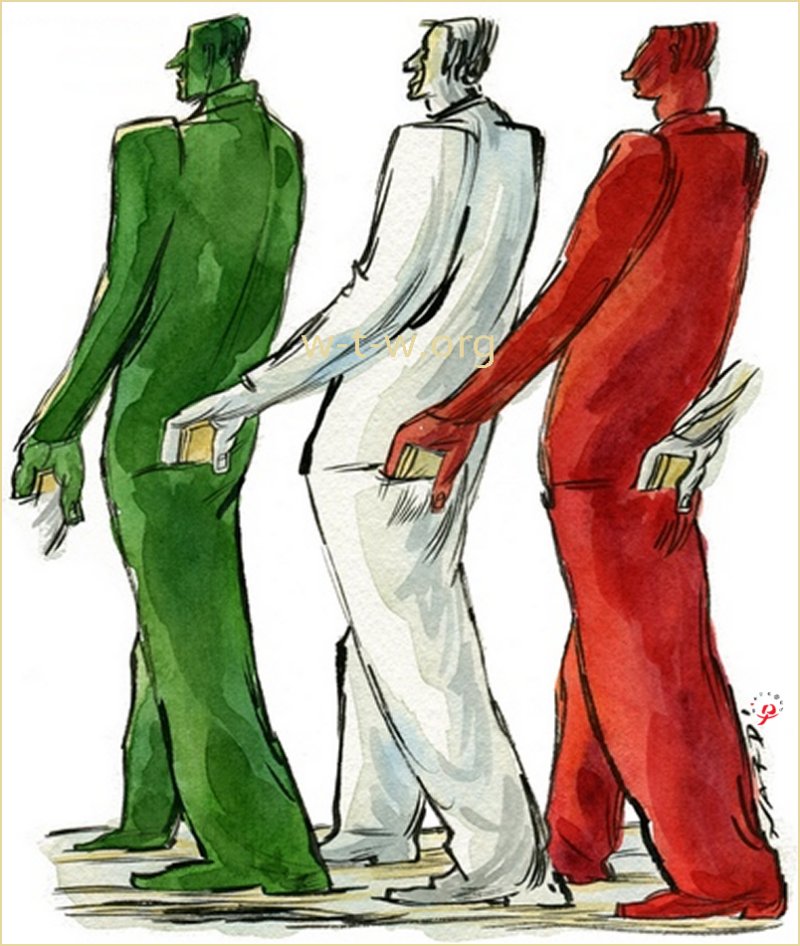
Marilena Nardi
www.w-t-w.org/en/cartoon/marilena-nardi
Pingback: How Corruption Affects Climate Change | W-T-W.org