Should We Use a Social Progress Index?

Laura Levis writes:  What are the ingredients of a  healthy, inclusive society—one that offers its citizens opportunity, happiness, and a positive quality of life? According to Lawrence University Professor Michael E. Porter, models of human development based on economic growth alone are incomplete; nations that thrive provide personal rights, nutrition and basic medical care, ecosystem sustainability, and access to advanced education, among other goods—and it is possible to measure progress toward providing these social benefits.

Porter’s 2015 Social Progress Index (SPI)—released in April and developed in collaboration with Sarnoff professor Scott Stern of MIT’s Sloan School and the nonprofit Social Progress Imperative—ranks 133 countries on multiple dimensions of social and environmental performance in three main categories: Basic Human Needs (food, water, shelter, safety); Foundations of Wellbeing (basic education, information, health, and a sustainable environment); and Opportunity (freedom of choice, freedom from discrimination, and access to higher education). Porter considers the index “the most comprehensive framework developed for measuring social progress, and the first to measure social progress independently of gross domestic product (GDP).”

The index, he explains, is in some sense “a measure of inclusiveness,” developed based on discussions with stakeholders around the world about what is missed when policymakers concentrate on GDP (which tallies the value of all the goods and services produced by a country each year) to the exclusion of social performance.

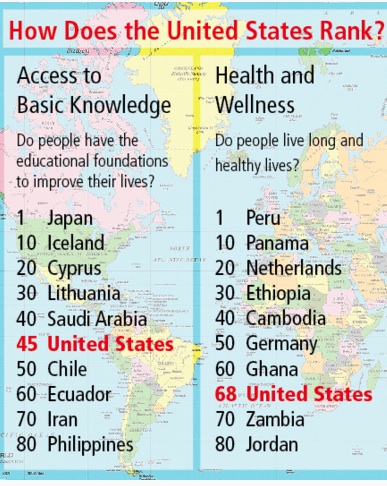
The United States may rank sixth among countries in terms of GDP per capita, but its results on the Social Progress Index are lackluster. It is sixteenth overall in social progress: well below Canada, the United Kingdom, Germany, and Japan in several key areas, including citizens’ quality of life and provision of basic human needs.

About 20 or 30 years ago, for reasons Porter says he cannot completely explain, the rate of progress in America began to slow down. As a society, he points out, Americans slowly became more divided, and important priorities such as healthcare, education, and politics suffered.

Meanwhile, he notes that even though other fast-growing nations such as India and China haven’t been able to attain a level of social progress commensurate with their economic progress either, certain countries such as Rwanda have “knocked the cover off the ball” in terms of social progress. “They went through a genocide, were devastated, and, to bring the society together, there was a consensus, led by the president, that their first job was to re-energize and restock the society and the capacity of their citizens,” he says. For example, the country achieved a 61 percent reduction in child mortality in a single decade, and today, primary-school enrollment stands at 95 percent. Rwanda also ranks high for gender equity, as women constitute a majority of the parliament—partly he says, because a lot of men were killed, but also because the country set out to be a place where women are not just equals, but leaders.

Porter hopes his continuing work on the index will help explain why the United States is “doing poorly” relative to other countries that are doing well.

In terms of progress for the average citizen, Porter warns, the United States is more threatened now, globally and economically, than it has been in generations.

Wellness?

The Economics of Responsible Global Citizenship

Raghuram Rajan writes:  As 2015 ended, the world boasted few areas of robust growth. At a time when both developed and emerging-market countries need rapid growth to maintain domestic stability, this is a dangerous situation.

So how does one offset weak demand? In theory, low interest rates should boost investment and create jobs. In practice, if the debt overhang means continuing weak consumer demand, the real return on new investment may collapse.

Another tempting way to stimulate demand is to increase government infrastructure spending. In developed countries, however, most of the obvious investments have already been made. And while everyone can see the need to repair or replace existing infrastructure (bridges in the United States are a good example), badly allocated spending would heighten public anxiety about the prospect of tax hikes, possibly increase household savings, and reduce corporate investment.

Structural reasons for slow growth suggest the need for structural reforms: measures that would increase growth potential by spurring greater competition, participation, and innovation. But structural reforms run up against vested interests. As Jean-Claude Juncker, then Luxembourg’s prime minister, said at the height of the euro crisis, “We all know what to do; we just don’t know how to get re-elected after we’ve done it!”

If growth is so hard to achieve in developed countries, why not settle for lower growth? After all, per capita income already is high.

One reason to press on is to fulfill past commitments. In the 1960s, industrial economies made enormous promises of social security to the wider public.   Technological change and globalization mean fewer good middle-class jobs for a certain level of growth, more growth is needed to keep inequality from widening.

Finally, there is the fear of deflation, the canonical example being Japan, where policymakers supposedly allowed a vicious cycle of falling prices, depressed demand, and stagnant growth to take hold.

In fact, this conventional wisdom may be mistaken. After Japan’s asset bubble burst in the early 1990s, the authorities prolonged the slowdown by not cleaning up the banking system or restructuring over-indebted corporations. But once Japan took decisive action in the late 1990s and early 2000s, per capita growth was comparable to that in other industrial countries. Moreover, the unemployment rate averaged 4.5% from 2000 to 2014, compared with 6.4% in the US and 9.4% in the eurozone.

If debt is excessive, a targeted restructuring is better than inflating it away across the board.

The specter of deflation haunts governments and central bankers. Hence the dilemma in industrial economies: how to reconcile the political imperative for growth with the reality that stimulus measures have proved ineffective, debt write-offs are politically unacceptable, and structural reforms frontload too much pain for governments to adopt them easily.

Developed countries have just one other channel for growth: boosting exports by depreciating the exchange rate through aggressive monetary policy. Ideally, emerging-market countries, funded by the developed economies, would absorb these exports while investing for their future, thereby bolstering global aggregate demand. But these countries’ lesson from the emerging-market crises of the 1990s was that reliance on foreign capital to fund the imports needed for investment is dangerous. I

By 2005, Ben Bernanke, then a governor at the Federal Reserve, coined the term “global savings glut” to describe the external surpluses, especially in emerging markets, that were finding their way into the US. Bernanke pointed to their adverse consequences, notably the misallocation of resources that led to the US housing bubble.

In other words, before the 2008 global financial crisis, emerging and developed countries were locked in a dangerous symbiosis of capital flows and demand that reversed the equally dangerous pattern set before the emerging-market crises of the late 1990s.

In an ideal world, the political imperative for growth would not outstrip an economy’s potential. In the real world, where social-security commitments, over-indebtedness, and poverty will not disappear, we need ways to achieve sustainable growth.

The bottom line is that multilateral institutions like the International Monetary Fund should exercise their responsibility for maintaining the stability of the global system by analyzing and passing careful judgment on each unconventional monetary policy (including sustained exchange-rate intervention). The current non-system is pushing the world toward competitive monetary easing, to no one’s ultimate benefit. Developing a consensus for free trade and responsible global citizenship – and thus resisting parochial pressures – would set the stage for the sustainable growth the world desperately needs.

Hands Holding Up Globe

How Much Does Good Health Care Cost?

Does being poor mean being less healthy? In the United States, the answer is generally yes: Income and health are intertwined, and the richer you are, the healthier you’re likely to be.

Still, the link between poverty and poor health isn’t ironclad. Take Costa Rica, where the poorest 25 percent of people live longer than their counterparts in the U.S., according to ananalysis published this week in the Proceedings of the National Academy of Sciences.

Costa Rica punches above its weight on many measures of health and social welfare. It’s a middle-income democracy with a population of 4.8 million—about the size of Alabama—and a per-capita gross domestic product about one-fifth that of the U.S. In other words, it’s much less wealthy than the U.S. As you would expect, the rich in America enjoy lower mortality rates than do the rich in Costa Rica. But when you look at the other end of the socio-economic scale, the reverse is true.

Why are the poor in one of the world’s wealthiest countries more likely to die at an earlier age than the poor in a small, middle-income country? Lifestyle factors have a lot to do with it. In the U.S., smoking and obesity are far more common at the bottom of the income scale. That’s not the case in Costa Rica.

“Poor people or lower socioeconomic-status people are thinner and less prone to obesity than rich people, while in the U.S., the inverse of that situation is true,” said Luis Rosero-Bixby, a demographer at the Universidad de Costa Rica and lead author of the study. Costa Ricans are more likely to adhere to traditional diets and lifestyles that don’t include junk food or cigarettes. Costa Rica’s health care system is not better than that of the U.S., according to Rosero-Bixby, but it manages to ensure that “the very basic needs are covered.”

While Costa Rica outperforms the U.S. on the health of its poorest, it’s not because the country has greater equality than America. Indeed, the income distribution in Costa Rica concentrates a greater share of wealth at the top, according to the paper. Somehow, though, skewed income doesn’t translate to skewed health outcomes.

The analysis linked census records in both countries with death registries from the 1990s. Matching that kind of data isn’t possible in many places, Rosero-Bixby said, so it’s hard to tell whether the pattern is similar elsewhere. Both countries are, to some extent, outliers. While Costa Ricans are generally healthier and live longer than the country’s income and health spending would predict, the reverse is true in the U.S..


EU Women Still Earn Less than Men

For the economy as a whole, women’s gross hourly earnings were on average 16.4 percent below those of men in 2013. The gap was most pronounced in Estonia where there was a 30 percent difference in what men and women make per hour. Spain, the United Kingdom and Germany also found themselves at the wrong end of the table. Slovenia has the narrowest gender gap when it comes to pay at just 3.2 percent.

EU's Gender Pay Gap

Tackling Global Workforce Problems in the 21st Century

The St. Louis Federal Reserve reports: With nearly four million jobs open in the U.S., almost two million in Europe and an estimated 85-million worldwide worker shortage by 2020,] the US is not alone in the charge to create workforce systems that better reflect the needs of the global workforce. The solutions to solving many of these issues go well beyond the borders of a singular community, state or nation.

Adding to the complexity of instituting effective workforce development programs is the paradigm between the global workforce shortage and technological advancements that threaten to displace many workers. Technology may be able to decrease a future global shortage by automating many of the jobs that are currently unfilled, but there is a need to ensure there are adequate jobs for people in the labor force.

The authors of an Oxford University report distinguish between jobs that are routine and those that are non-routine, which require more cognitive skills. The more creative intelligence a job requires, the less likely it is to be done by a computer. The report analyzes 702 occupations and categorizes them by the potential to be automated: low, medium and high-risk. Interestingly, the authors predict that computerization will reduce the demand for low-skill and low-wage jobs in the near future rather than middle-income occupations, which has been the recent pattern.

In a more global economic system with so many constantly shifting factors, it is difficult to determine the types of jobs and technical skills that will be required for future generations.

Foreign Direct Investment in the U.S.: Top 15 FDI Stock Positions, 2012

Rank Country % of Total Investment ($2.7 Trillion) U.S. Dollars (in Billions)
1 United Kingdom 21% $564.7B
2 Japan 12% $309.4B
3 Germany 10% $272.3B
4 Canada 10% $261.1B
5 France 8% $221.7B
6 Netherlands 5% $130.1B
7 Ireland 5% $127.7B
8 Switzerland 5% $126.0B
9 Spain 2% $51.9B
10 Australia 2% $51.1B
11 Belgium 2% $47.7B
12 Sweden 2% $41.4B
13 Italy 1% $33.2B
14 Norway 1% $30.8B
15 Mexico 1% $29.2B

Since Germany is one of the top investors in the U.S. for FDI, they want to ensure a future pipeline of skilled American workers. German manufacturing companies have identified finding and retaining workers with the right skills as the biggest challenge for German companies operating in America.  One of the international workforce programs gaining attention in the U.S. is the German dual vocational education system, which focuses on youth employment and occupational certifications through education and apprenticeships for over 330 occupational competencies.

In the U.S., 0.2 percent of the labor force work as apprentices compared with 3.7 percent of the German workforce. German apprentices are mostly high school students between the ages of 16 and 19; the median age for an American apprentice is 26. Additionally, youth unemployment levels in 2014 were lower in the countries that have adopted the German system (e.g., Austria, Germany, Switzerland) compared with other European countries in the region near Germany and with the U.S.

TABLE 2

2014 Youth Unemployment Levels

Country Youth Unemployment
Spain 53.2%
France 24.2%
Ireland 23.9%
Poland 23.9%
Belgium 23.2%
United Kingdom 16.9%
Czech Republic 15.9%
United States 14.3%
Netherlands 12.7%
Austria 10.3%
Switzerland 8.6%
Germany 7.7%

Another characteristic of the German system is involvement from the private sector. Industry helps to shape and redefine the list of occupational standards to ensure that they are the skills needed for the workforce. German companies pay for two-thirds of the costs associated with initial training for each apprentice – about 15,300 euros each year per trainee. This allows companies to improve their recruitment of qualified new employees, save on costs associated with training new hires, avoid hiring the wrong workers and better ensure that workers have the needed skills to perform in the workplace.

Many American cities and states are creating partnerships to integrate at least some aspects of the German system into their workforce development policies, especially in the manufacturing sector. According to The German Vocational Training System: An Overview, “As countries with strong internationally competitive economic, scientific and technological capacities, the USA and Germany have a strong strategic interest in the best concepts for qualification. Both countries design education and training based on the economic and societal demands of lifelong-learning, which focus on competencies and employability, as well as the promotion of transparent and transferable qualifications and the broadening of career paths.”[7] As this system continues to be adopted throughout the U.S., it is also important to look at other international workforce development systems that may have an impact in this country.

Many nations in Southeast Asia continue to have rapid economic growth and an ever-increasing need to ensure that their workers have the skills necessary to fill the jobs in many growth industries. According to Trading Economics, Singapore’s unemployment rate at the end of the second quarter of 2015 was 2 percent.[8] The rate has averaged only 2.48 percent from 1986 to 2015. From a workforce and economic development strategy, this situation shifts the focus from teaching skills to potentialworkers to improving the skills of existing workers to meet the demand for growth industries.

In 2015, Singapore announced new workforce strategies that place a strong emphasis on mid-career workers and ongoing learning to upskill current workers.[9] The Singapore Workforce Development Agency (WDA) is not just targeting workers in the trades, but also those in professional, management and even executive jobs. Ng Cher Pong, chief executive of WDA, explained, “The fundamental change under the sectoral manpower strategy is a much closer integration between economic development and manpower development. We are hoping through this process, it will pull the two much closer together and we have some of the conversations upfront, rather than have the economic development run ahead of the manpower development.”[9] As with the occupational standards in Germany, the sectoral manpower strategies in Singapore work with businesses, unions, educational institutions and government to identify the skills needed for the current and future workforce. The Singapore model will also use these standards to create “progression pathways” across an entire career with regard to the competencies and skills needed throughout various stages of a worker’s career.

Various global workforce development agencies are using particular standards of skills across industries to better align workers with the skills needed to compete for jobs and to narrow the workforce gaps that exist in some industries. Technology continues to help solve skills and workforce shortages, but at the same time threaten jobs of many workers worldwide. Additionally, the global nature of the evolving workforce creates opportunity and the need for workforce strategies that connect countries of investment to ensure workers have the skills for continued investment for economic growth. In a recent interview on Wharton Business Radio’s “Behind the Markets” with Jeremy Schwartz and Professor Jeremy Siegel, James Bullard, president of the Federal Reserve Bank of St. Louis, articulated the need for these alliances to improve the U.S. workforce. He said, “I think it would be a very good change in the national conversation to move toward talking about how can we improve productivity from the very low levels that it is today up to more reasonable growth rates that are consistent with historical trends and that would be the No. 1 thing that you could do for the U.S. economy over the medium term and the long term. I agree, though, that when you look at research on these questions, the human capital side of the U.S. does not look as good as it needs to. We need to get much better training and the right sort of training for the jobs that are actually going to be available and needed going forward.”

Inflation: All Ships Don’t Rise with a Rising Tide

Philip Pilkington writes:    Real people — and their representatives in government — don’t like inflation much you see. “Irrational nonsense!” says the vulgar Keynesian policy enthusiast, “when the price of everything goes up, your wage should rise as well. Why? Because on average, we are all sellers of something. If you work in a tea shop and the price of tea goes up, your wage can be expected to go up as well, and so forth. Remember, every dollar that one person spends becomes the income of another person!” (Adam  Smith)

That sounds great but things are actually a little more complicated. In fact, the man in the street’s distrust of inflation is probably more grounded than Smith’s abstractions. Why? Because inflation has a distributive element: it does not affect all income groups equally.

Inflation almost certainly hits lower income groups harder than higher income groups. The main reason for this is because food and energy inflation tends to be rather high, while the price of cars and electronic equipment and the like tends to be either steady or falling over time. You can see this with respect to the UK in the graph below:

Inflation1

Food and energy, of course, makes up a greater part of the basket of lower income households than it does higher income households. So what we did was we came up with new weights for the RPI which we thought more accurately reflected the baskets of lower income households. Since we did not have access to survey data we had to basically just make up the weights, but I think they are at least somewhat reasonable. Here is a list of the old weights versus the new weights:

Inflation2

And here are the results we got by comparing the RPI with the new lower income group inflation measure:

Inflation3

What we see is that the lower income group basket is more sensitive to price fluctuations than the standard inflation measure. If we had constructed a high income group basket and compared it, the lower income group basket would be even more sensitive again. This means that in times of high inflation lower income groups tend to see their incomes eroded more rapidly than higher income groups.

Inflation redistributes income from creditors to debtors as the real value of debt is eroded. That is generally good for lower income households. But these households do not generally see this or understand it. They do see, however, that their costs are rising while the wealthy family down the road are not experiencing the same pain and this is likely to irritate them.

Keynesian policy enthusiasts should always remember that we live in a democracy; not a technocracy run by them. If they want their policies to be put in place they require the consensus of elected leaders which ultimately means the consensus of the mass of citizens. For this reason it is probably not such a good idea to go around “celebrating” inflation. Indeed, it often comes across as elitist and lacking in any populist appeal which makes it an easy target for libertarian types who prey on peoples’ fears and misunderstandings to spread ignorance and bad ideas.

Is Apprenticeship the Answer to Job Training?

The Philadelphia Federal Reserve writes:  Government, foundation, and workforce leaders are displaying keen interest in apprenticeships as a way to give job seekers skills, credentials, and access to careers. This increased interest is also part of the greater attention to workforce development strategies that engage employers.Apprenticeships have a long history with roots in ancient times. The Code of Hammurabi of Babylon, which dates back to the 18th century bce, required artisans to teach their crafts to the next generation. By the 13th century, a type of apprenticeship emerged in Western Europe in the form of craft guilds.[1] In the colonial U.S., now-famous apprentices included George Washington (surveyor), Benjamin Franklin (printer), and Paul Revere (silversmith).

RAs, authorized under 78-year-old federal legislation, are getting more attention in recognition of the critical importance of engaging private-sector employers in addressing the workforce needs of unemployed and underemployed people. RAs, with a combination of structured OTJ training and related training and instruction, hold the promise of industry-recognized credentials and career access. RAs have been used primarily in the skilled trades and construction, but recent DOL grants are intended to catalyze their use by new populations in high-growth industries with new program models.

As private-sector employers weigh the costs and benefits of apprenticeships, intermediaries can assist employers to design programs, recruit participants, and register RA programs. The intermediaries range from state programs such as Apprenticeship Carolina, nonprofits such as Vermont Healthcare and Information Technology Education Center (HITEC), and joint labor – management programs.

The declarations of intent signed this summer between the U.S. Departments of Commerce, Education, and Labor and their counterparts in Germany and Switzerland reflect a growing desire to learn from countries where apprenticeships are successfully embedded in educational and employment systems. The inherent challenge will be to apply and implement successful practices in the U.S. despite differences in educational systems and employment practices.  Apprenticeship

Printer's Apprentice


Can Companies Be More Just?

Brian Dumaine writes:  Famed investor Paul Tudor Jones believes that we’re headed for trouble if we don’t shrink the wealth gap. His solution? Pressure companies to be more just.

Jones, 60, who has an estimated net worth of $4.5 billion, was having coffee one day with Deepak Chopra, the holistic medicine advocate and bestselling author, who knows the Wall Street titan through Jones’s wife, Sonia, an Australian by birth who runs a yoga and wellness business. Chopra had grown deeply concerned about income inequality. “I had been going to Occupy Wall Street meetings and saw the rage but didn’t see the solutions,” he says.

During a spirited discussion with Jones about America’s disappearing middle class, Chopra, who teaches a course at Columbia Business School called Just Capital & Cause-Driven Marketing, brought up an idea one of his students had suggested in class: create a stock market index that would drive capital to companies that treated their employees and communities well. The concept of a market-driven approach appealed to Jones, the onetime cotton trader who founded Tudor Investment Corp. in 1980, became famous by predicting the crash of ’87, and today manages $13.8 billion. “I thought, Wouldn’t this be a great thing to do?” says Jones.

Jones did some quick research—and was both surprised and more than a little embarrassed to discover that taking a values-based approach to the stock market was hardly an original thought.

Then Jones had a different idea: Why not rank America’s top 1,000 companies based not on what Wall Street values—profits—but rather on what Main Street wants? If the list caught on, he reasoned, companies might someday vie to be ranked higher than their rivals. And to do so they would have to pay workers more fairly, make products more sustainably, and give more back to the community.

To put his plan into action, Jones earlier this year created a nonprofit called Just Capital. The mission is to research what makes people like or dislike corporations and then to create an annual list—which will debut in the fall of 2016—tentatively called the Just 1000. “We want to give the American public a voice where it’s never had a voice,” says Jones. “It’s going to be crystal clear and unbiased and without prejudice. And it’s going to drive corporate behavior.”

Skeptics might wonder what kind of difference a simple list can make. But Jones believes that harnessing public opinion can prove powerful—and that changing the behavior of big companies could have a cascading effect.

(To read about 51 companies already having a positive impact, see our Change the World list.)

Fed Uptick on Interest Rates and Inequality

 The Fed has been accused of exacerbating inequality. Seven years of near-zero interest rates have hurt Americans looking to put money aside for retirement (effectively losing money in deposit accounts when inflation is taken into account), but helped the wealthiest by propping up the value of share prices and other assets.

Fed officials believed the “wealth effect” from quantitative easing would benefit the broader economy – akin to the Republican premise of trickle-down economics – by allowing people with more valuable assets to spend more. This has not happened.

The 20 richest Americans have amassed a fortune that is larger than all the wealth of the least wealthy half of the population, 152 million people, according to a recent study by the Institute for Policy Studies, with the biggest income gains coming in the last six years. Since 2009, some 95 per cent of the earnings growth has floated to the top 1 per cent.

Almost 50 per cent of US aggregate income went to upper-income households in 2014, up from 29 per cent in 1970, Pew Research said in a report last week showing a hollowing-out of America’s middle class. The share going to middle-income households has fallen from 62 per cent in 1970 to 43 per cent in 2014.

The Fed’s rate hike may not help alleviate the pain of economic inequality either. Banks and credit unions may decide to keep interest rates on savings low while cranking up rates on mortgages and other consumer loans, using the higher rates to recover fees and boost profits.  Fed Uptick on Interest Rates and Inequality

Inequality