Why Don’t Bankers Go To Jail?

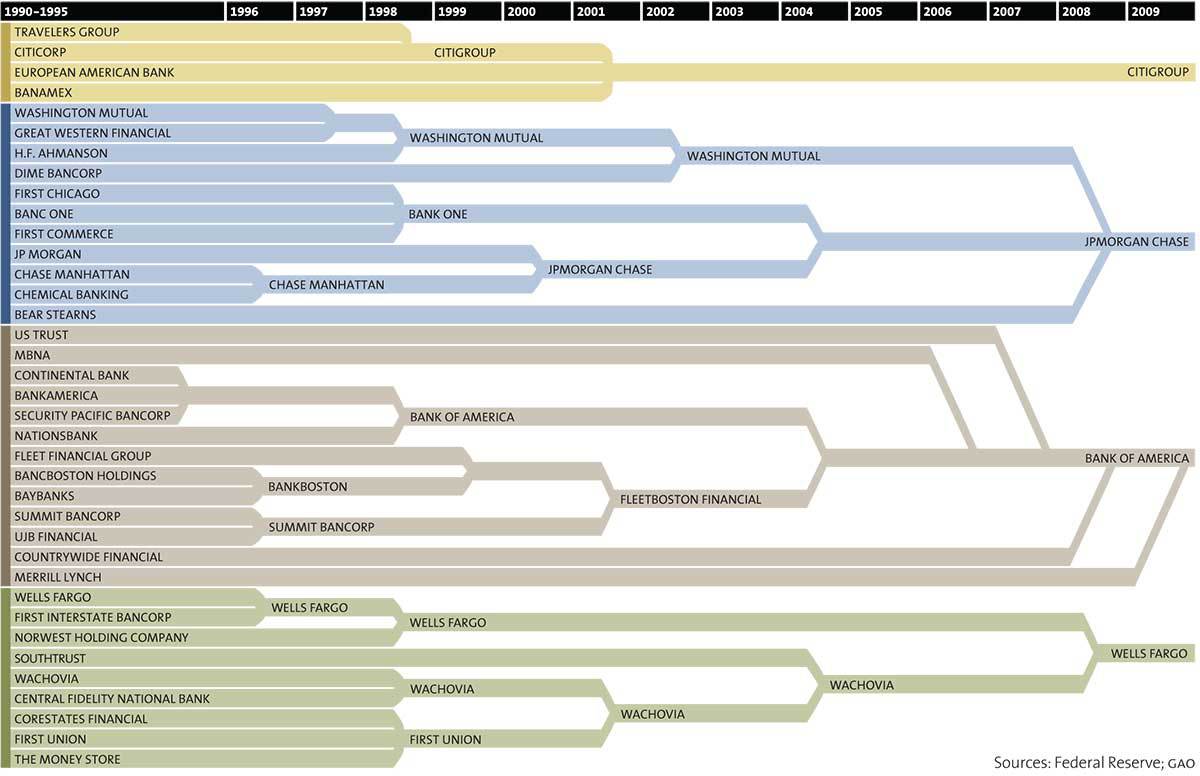
Philip Angelides, a former Treasurer of California, headed the commission which issued a report which was widely criticized, both by those who felt is didn’t go far enough (see references below) and by some commission members who felt it went too far and resulted in conflicting minority reports.  

“I ask a simple question: how could the banks have engaged in such massive misconduct and wrongdoing without a single individual being involved? In a sense, it’s the immaculate corruption. It defies common sense, and the people of America know this.”     Angelides Letter to Department of Justice

Jail Bankers?

Is it Easier to Obscure Economic Truths with Words or Equations?

Philip Pilkington writes: Does mathematics, due to its formal nature, provided economists with clarity? This was then typically followed up with appeals to how economics might become a science by increasingly mathematising.

A good example of mathematics providing clarity is the case of the Keynesian multiplier. Even without inputting any numbers into the equation we can immediately discern the factors that will generate equilibrium income. It will be a component of autonomous consumption, investment, I, government spending, and exports, minus autonomous imports. It will also be positively multiplied by the consumption multiplier, and negatively multiplied by the import multiplier.

We know this because the components of income are in the numerator of the equation, while the multipliers are in the denominator. The multipliers are also being subtracted from/added to 1. The larger the denominator, the smaller the numerator and vice versa. So, anything that “subtracts” from the denominator — e.g. the consumption multiplier — will increase the ratio (same directional effect as adding to the numerator), while anything that “adds” to the denominator — e.g. the import multiplier — will decrease the ratio (same directional effect as subtracting from the numerator.

Compare this presentation, however, with your typical econometric study. Such studies contain innumerable “black boxes” in that the reasoning behind the assumptions made is often entirely unclear.

One thus spends hours attempting to interpret and reconstruct such a study and, all too often, one comes away realising that the assumptions lead one inevitably to interpret the results as being almost entirely arbitrary.

One recognises the labour that goes into such studies but at the same time untangling it becomes “a nightmare to live with”. Why? Because such studies do not promote clarity at all. Instead they promote complete and total obscurantism.

This is not to say that econometrics is entirely useless. As Keynes says in the Tinbergen critique: This does not mean that economic material may not supply more elementary cases where the method will be fruitful. Take, for instance, Prof. Tinbergen’s third example-namely, the influence on net investment in railway rolling-stock of the rate of increase in traffic, the rate of profit earned by the railways, the price of pig iron and the rate of interest. Here there seems a reasonable prima facie case for expecting that some of the necessary conditions are satisfied.

Alas, however, these mathematical techniques have a tendency, not to clarity at all, but to obscurantism and the moment one gives people a ticket allowing them to engage in obscurantist practices one runs the risk of spiking the proverbial punch.

It is far, far more difficult to engage in obfuscation and magical nonsense when using plain English than it is when using mathematics; not to mention the fact that it is far easier to catch people out. And as a general rule-of-thumb it is probably not unfair to say that as the number of equations grows, the lack of clarity tends to increase and so too do the difficulties in sorting the wheat from the chaff. It is thus the multiplication and proliferation of equations that tends to give rise to nightmares.

Math and Economics

Negative Rate Creep?

The negative-rates club is growing. But there is a limit to how low rates can go, according to the economist.  But they do not define what that limit is.

The Economist suggests: Let’s take a different look at what negative interest rates mean from the point of view of supply and demand.  The -1% deposit rate for Switzerland indicates the expectation that the Swiss franc will buy about 10% more than it will today in 10 years.  (To be exact, the expectation is for 10.46% more value.)  Why will it buy more?  Well, for just the opposite reason that +1% interest rates indicate a 10% loss of value expectation over 10 years.  With the loss of value the effect is known as inflation which is generally considered due to too much money chasing too few goods.  The solution for inflation is to make money more expensive or less available.  The opposite applies for monetary deflation implied by negative interest rates:  There is not enough money available to buy the goods available.  In the current environment the shortage results from an excess of “debt goods” to be bought.  So the solution to deflation is either to make the goods more scarce (write off debt) or increase the amount of money available.  QE is a process attempting to make debt instruments more scarce in the economy, although the scarcity may be temporary if the central bank later sells debt securities, as opposed to debt write-off which is forever permanent.  (“Forever permanent ” is a deliberate redundancy, for emphasis.)  See the preceding article for a view that rising wages and incomes are going to supply the money that will reduce deflation (or increase inflation).

But we ask the following question:  Where will the money come from to pay the higher wages?  The choices we suggest are (the third is not done today with the existing monetary system):

  1. Fewer people employed.
  2. More debt to create additional money.
  3. Infusion of money without the creation of debt.

How Women in the Workforce Help the Norwegian Economy

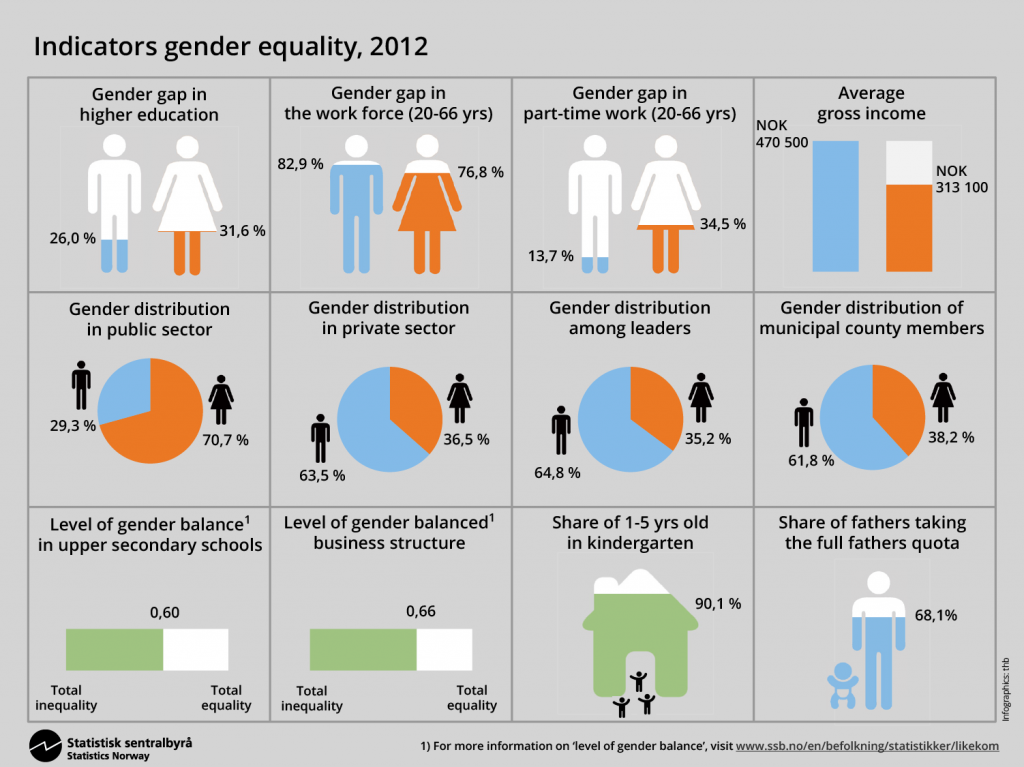
Any country’s main asset is its workforce, and Norway, with its oil wealth, is no exception. Sustainable policies for low unemployment and high participation rates for women, men and young people are predominant and the burden sharing of the cost of the welfare state is carried on the back of the labour force.

In the last 50 years, there has been a tremendous change in women’s participation in paid work in most OECD countries. Labour market participation has been a key to economic independence for women. It has given women the possibility to develop and use their professional skills. Employment among women is also crucial for economic performance. This may prove especially important in the years to come, as an ageing population will place an increasingly severe burden on public finances. Old age pension expenditure will increase, as will government outlays for health care. Low birth rates will add to the problem, and a shrinking working-age population will have to provide for an increasing number of pensioners. To encourage women with children to go out to work, Norway and the other Nordic countries have implemented policies that make it easier to combine work and family life.

Now some 83% of mothers with small children are employed. Fertility rates have risen along with the rise in labour participation, from 1.75 children per woman at the end of the 1970s to 1.9 children per woman today–one of the highest fertility rates in Europe.

The increase in female employment in Norway took place at a time when there was a rise in demand for labour, and alongside a remarkable boost in educational attainment among women. Secondly, employment among women was stimulated by comprehensive parental provisions and subsidised day-care for children. In 1970 only 13,000 Norwegian children were enrolled in day-care centres. Today the number is about 280,000 with coverage of almost 90% of all 1-5 year olds. Parental leave for employed mothers and fathers is paid from public budgets and has been extended from 12 weeks 30 years ago to 47 weeks today. Other measures are a statutory right to paid leave to stay at home with sick children and a right to work part-time until the youngest child turns 12.

Choosing workers from a pool of male and female workers, as opposed to choosing from a pool where half of the potential talent is excluded, leads to productivity gains. Secondly, higher female labour participation has led to productivity gains through a higher degree of specialisation. And finally, female employment has added more workers to the work force at a time when average work hours per employed person have been declining. .

In fact, if the level of female participation in Norway were to be reduced to the OECD average, Norway’s net national wealth would, all other factors being equal, fall by a value equivalent to our total petroleum wealth, including the value of assets held in the Government Pension Fund-Global (GPG, formerly the petroleum fund).

The next step for Norway will be to find ways to encourage people to move from part-time work to full-time work. With family provisions and childcare already in place,  this is within reach.

Women in the Norwegian Workforce

More Women At the Top Increases Corporate Success

New research from The Peterson Institute for International Economics and Ernst and Young shows that having more female leaders in business can significantly increase profitability. The report, Is Gender Diversity Profitable? Evidence from a Global Study, reveals that an organization with 30 percent female leaders could add up to 6 percentage points to its net margin. This in-depth new study analyzes results from approximately 21,980 global publicly traded companies in 91 countries from a variety of industries and sectors.

“The impact of having more women in senior leadership on net margin, when a third of companies studied do not, begs the question of what would be the global economic impact if more women rose in the ranks?” said Stephen R. Howe, Jr., EY’s US Chairman and Americas Managing Partner. “The research demonstrates that while increasing the number of women directors and CEOs is important, growing the percentage of female leaders in the C-suite would likely benefit the bottom line even more.”

The research uncovered that nearly one-third of companies globally have no women in either board or C-suite positions, 60 percent have no female board members, 50 percent have no female top executives, and less than 5 percent have a female CEO. Yet, the positive correlation between women in C-level ranks and the bottom line is demonstrated repeatedly, and magnitude of the estimated effects is substantial.  Although the study found that there is no statistically observable impact of having a female CEO on organizational profitability, and the impact of women’s presence on the board is not statistically robust, the importance of having female management and presumably a pipeline of female future leaders is both robust and positive.

“As many companies and governments have rightly increased their focus on gender diversity in corporate leadership, The Peterson Institute and EY wanted to explore what key areas in business roles and in societal support for women in those roles, have the greatest return for revenue and economic growth,” said Adam Posen, President, The Peterson Institute for International Economics. “We have found that some policy initiatives are more promising than others to deliver benefits while promoting gender equality, and that the emphasis should be on increasing diversity in corporate management. At a minimum, the results from our unique global study strongly suggest the positive impact of gender diversity on firm performance and identify in which sectors and countries the most progress on diversity needs to be made.”

While no country has reached gender parity, there is substantial international variation in women’s representation. National averages for women’s participation on boards range from 4 percent in the case of Mexico to roughly 40 percent in Norway, with Latvia and Italy next in line at 25 and 24 percent, respectively. Similarly, fewer than 11 percent of Mexican executives are women, while women account for more than a third of Latvian and Bulgarian executives.

The research reveals differences across industry sectors, with the financial, healthcare, utility and telecommunications sectors exhibiting the highest rates of female executive and board representation, ranging from 16-18 percent for women executives, and 12-14 percent for women directors. Basic materials, technology, energy and industrials are the sectors exhibiting the lowest representation of women in top positions, ranging from 10-12 percent for women executives and 8-10 percent for women directors.

The research addresses other issues that impact women’s presence in corporate leadership, which is positively correlated with firm characteristics such as size, as well as national characteristics including policies for women’s education and family leave. The research’s statistical results suggest that at the firm level, the size of the company and the size of the board are robustly correlated with the presence of women on boards and in upper executive ranks (though not as CEOs).

This research sheds light on the importance of establishing modern workplace benefits, providing equitable sponsorship opportunities, and creating inclusive work environments.

The data points to other policy indicators positively correlated with gender diversity in management, and thus profitability, that  are often overlooked, including the importance of paternal (not just maternal) leave, and openness to foreign investment, which could be interpreted as a sign of broader tolerance for new ways of doing business. Paternity leave – resources that would allow, and even encourage, fathers to participate more equitably in taking care of children – is significantly greater in the economies with more gender-balanced corporations: the top 10 economies had 11 times more paternity leave days than did the bottom 10.


Middle Class Erosion Increases Inequality?

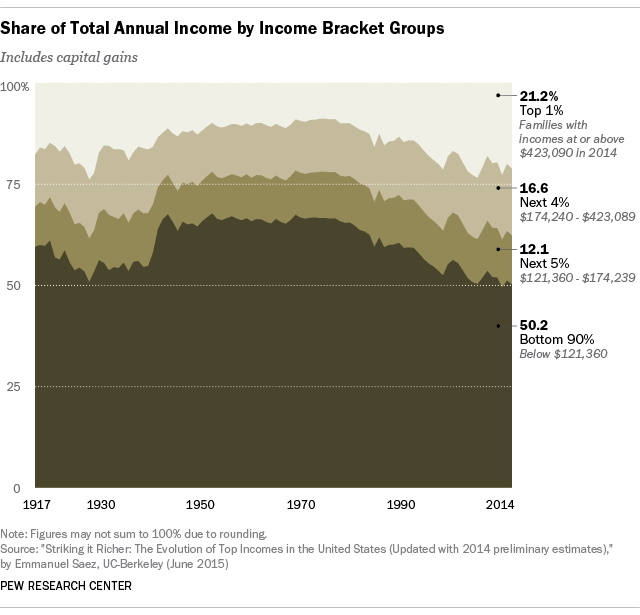
States Where the Middle Class Is Dying in the US There are many possible definitions of the middle class.  One very logical definition involves dividing incomes into five quintiles.  Then the income classes can be labelled as follows:

  • Lowest quintile:  Low Income
  • Second quintile:  Low Middle Income
  • Third quintile:  Middle Income
  • Fourth quintile:  Upper Middle Income
  • Highest quintile:  High Income

Based on income earned before taxes by the third quintile, middle class incomes in Rhode Island declined the most in the country. Incomes among middle class Rhode Island households fell by 3.1% from 2010 to 2014, while income among the state’s fifth quintile, the top 20% of state households, grew by 4.5%.  This is representative, but to a greater extent, of what has happened to the distribution of income across the U.S.  See next article.

Observations in this article about characteristics of the states with the greatest middle income losses (not all found in every bottom 10 states):

  • More regressive taxation.
  • Low or declining union membership
  • High property taxes
  • More than average employment decline

Econintersect:  However, ranking of growth in high incomes shows little correlation with the decline in middle incomes.  The ten states have an average rank of of 21 (rank 1 being the greatest high income gain).  None of the ten states ranked by greatest middle income loss ranked in the top ten for high income gain (Maine had the highest rank – 11th).  But neither did any of the top  ten states for middle income loss rank in the bottom two quintiles for high income gain (South Carolina had the lowest rank – 29th).  These observations appear to indicate that state by state the loss of middle income is not strongly associated with either (1) large high income increases or (2) general economic decline for a state.

Here are the ten states that have had the greatest middle income losses between 2010:

10.  Arkansas  9.  New York 8.  Montana 7.  California 6.  South Carolina 5.  Tennessee 4.  North Carolina 3.  Maine 2.  Georgia 1.  Rhode Island

FT_15.09.16_econInqualityUpdate

Infrastructure Investment?

Elizabeth Drew writes: It would be helpful if there were another word for “infrastructure”: it’s such an earnest and passive word for the blood vessels of this country, the crucial conveyors and connections that get us from here to there (or not) and the ports that facilitate our trade (or don’t), as well as the carriers of information, in particular broadband (if one is connected to it), and other unreliable structures. The word “crisis” is also overused, applied to the unimportant as well as the crucial. But this country has an infrastructure crisis.

The near-total failure of our political institutions to invest for the future, eschewing what doesn’t yield the quick payoff, political and physical, has left us with hopelessly clogged traffic, at risk of being on a bridge that collapses, or on a train that flies off defective rails, or with rusted pipes carrying our drinking water. Broadband is our new interstate highway system, but not everyone has access to it—a division largely based on class. Depending on the measurement used, the United States ranks from fourteenth to thirtieth among all nations in its investments in infrastructure. The wealthiest nation on earth is nowhere near the top.

Congress’s approval last December of a five-year bill to spend $305 billion to improve the nation’s highway system occasioned much self-congratulation that the lawmakers actually got something done. But with an increase in the gasoline tax politically off-limits, the means for paying for it are dubious and uncertain. This was the longest-term highway bill passed since 1998 and the thirty-fifth extension of an authorization of highway construction since 2005. Some of the extensions of the highway program approved by Congress lasted for only three months. The previous extension was for just over three weeks. Such practices don’t allow for much planning of the construction or repair of highways and bridges and mass transit systems.  Infrastrcture Repair in US

Why Banks Should Be Regulated

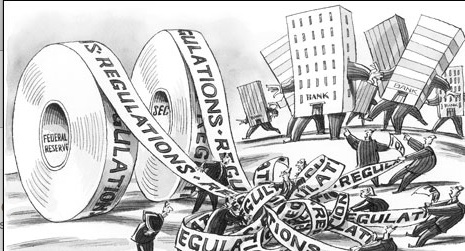
The problem is not that banks are too big too fail.  They are too important not to have democratic control.  This is the only business whose product is other people’s money.  Currently in the US, taxpayers’ money insures taxpayers’ accounts up to $250,000 so that banks can gamble with impunity.  Bank Regulation

Bank regulation

Corruption in the Ukraine?

 The International Monetary Fund is concerned about the decision of Aivaras Abromavicius to resign from the post of Minister of Economic Development and Trade, IMF Managing Director Christine Lagarde said.

“His recently announced resignation is of concern. If the allegations that he makes in his resignation are correct, then it is obviously an indication that anticorruption measures that were committed to by the government are not yet working. And there is more progress to be had in that area. We’ve known that all along,” she said.

Ukraine corruption?